What a 6-minute ML outage costs: 372 failed requests and 5.7% of the month's error budget
The claim
I scaled my model server to zero replicas to see what my monitoring would do. An alert fired about two minutes after the failures began. The outage lasted about six minutes, 372 requests failed, and against a 99.5% monthly availability objective that used 5.7% of the error budget. The latency graph, which is the first panel most dashboards show, stopped drawing instead of turning red.
Setup
A small ML platform on one machine, built to practice the pieces a platform team owns.
- Single-node k3s (v1.36.4) on a desktop with 32 GB of RAM, CPU only.
- MLflow 3.18.0 with Postgres as the registry. A scikit-learn random forest trained on synthetic data, registered under the alias
prod. - One
servingpod runsmlflow models servefor whateverprodpoints to. - A small prober pod inside the cluster sends one prediction request per second (a fixed 12-feature row) and exposes two Prometheus metrics: a latency histogram and a counter of requests by result,
okorerror. I wrote it because the model server exposes no request metrics of its own. - Prometheus (15 s scrape interval, rules evaluated every minute) and Grafana.
- Objectives I set: 99.5% of requests succeed, and 99% of successful requests finish in 50 ms or less, over 30 days.
- One alert:
kube_deployment_status_replicas_available{deployment="serving"} < 1for 2 minutes.
I shut the machine down every night, so I count only the hours the platform runs: 12 hours a day. At one request per second that is about 1.3 million requests per 30 days. The availability budget (0.5%) is about 6,480 failed requests, equal to 108 minutes of complete outage.
Evidence
I ran kubectl scale deploy/serving --replicas=0, watched, and scaled it back up. Times are UTC.
| Time | What happened |
|---|---|
| 19:37:50 | ServingUnavailable goes pending (within about 15 s of the command) |
| 19:38:00 | the error counter starts rising |
| 19:39:50 | alert goes firing, exactly 2 minutes after pending |
| 19:44:15 | the new pod passes its readiness check; requests succeed again; the error counter stops at 372 |
| 19:44:35 | alert resolves, about 20 s after recovery |
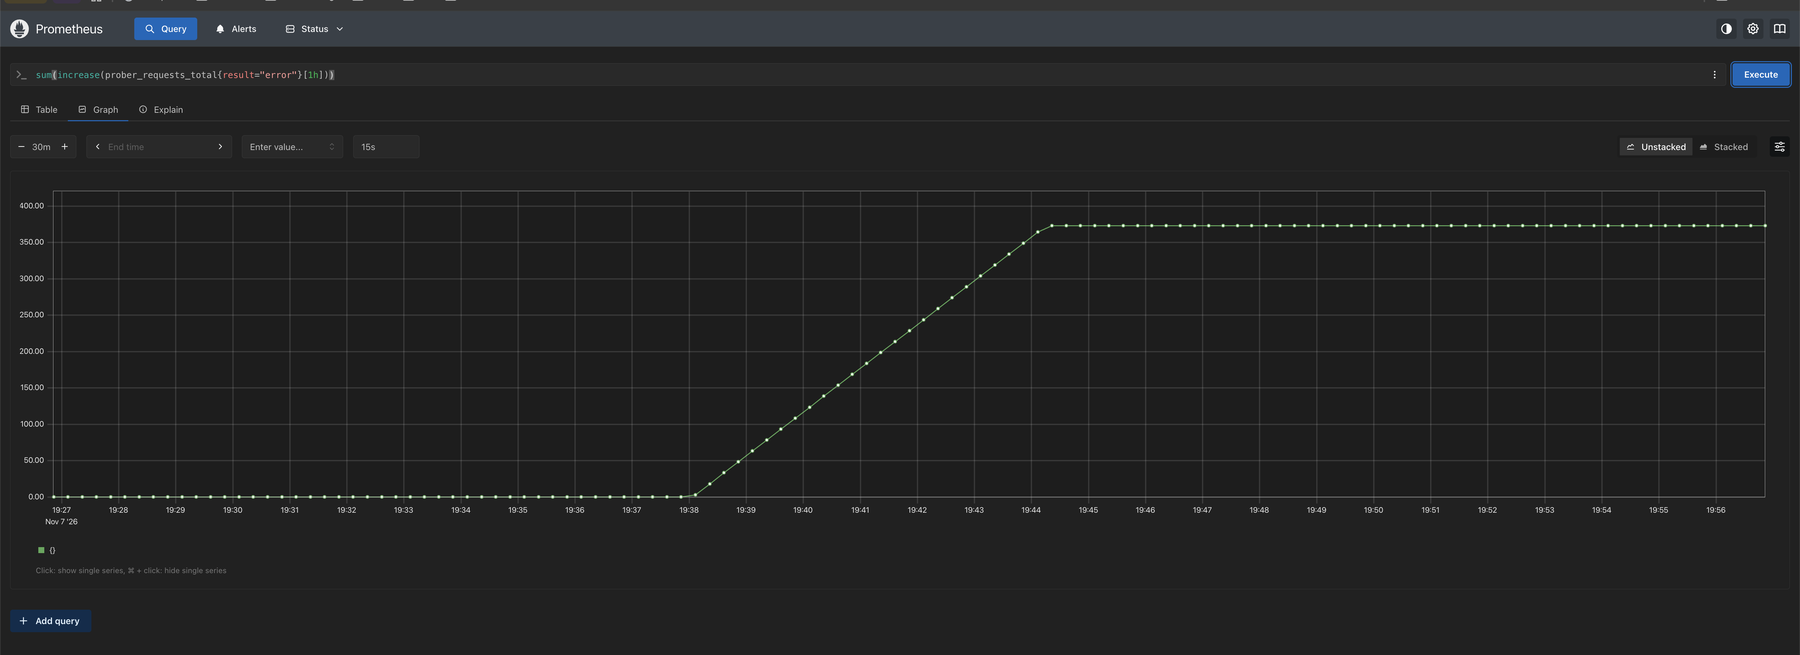 Figure 1: failed requests in the last hour,
sum(increase(prober_requests_total{result="error"}[1h])) (Prometheus, UTC). It stays at 372 because the query looks back one hour; it does not mean errors continued.
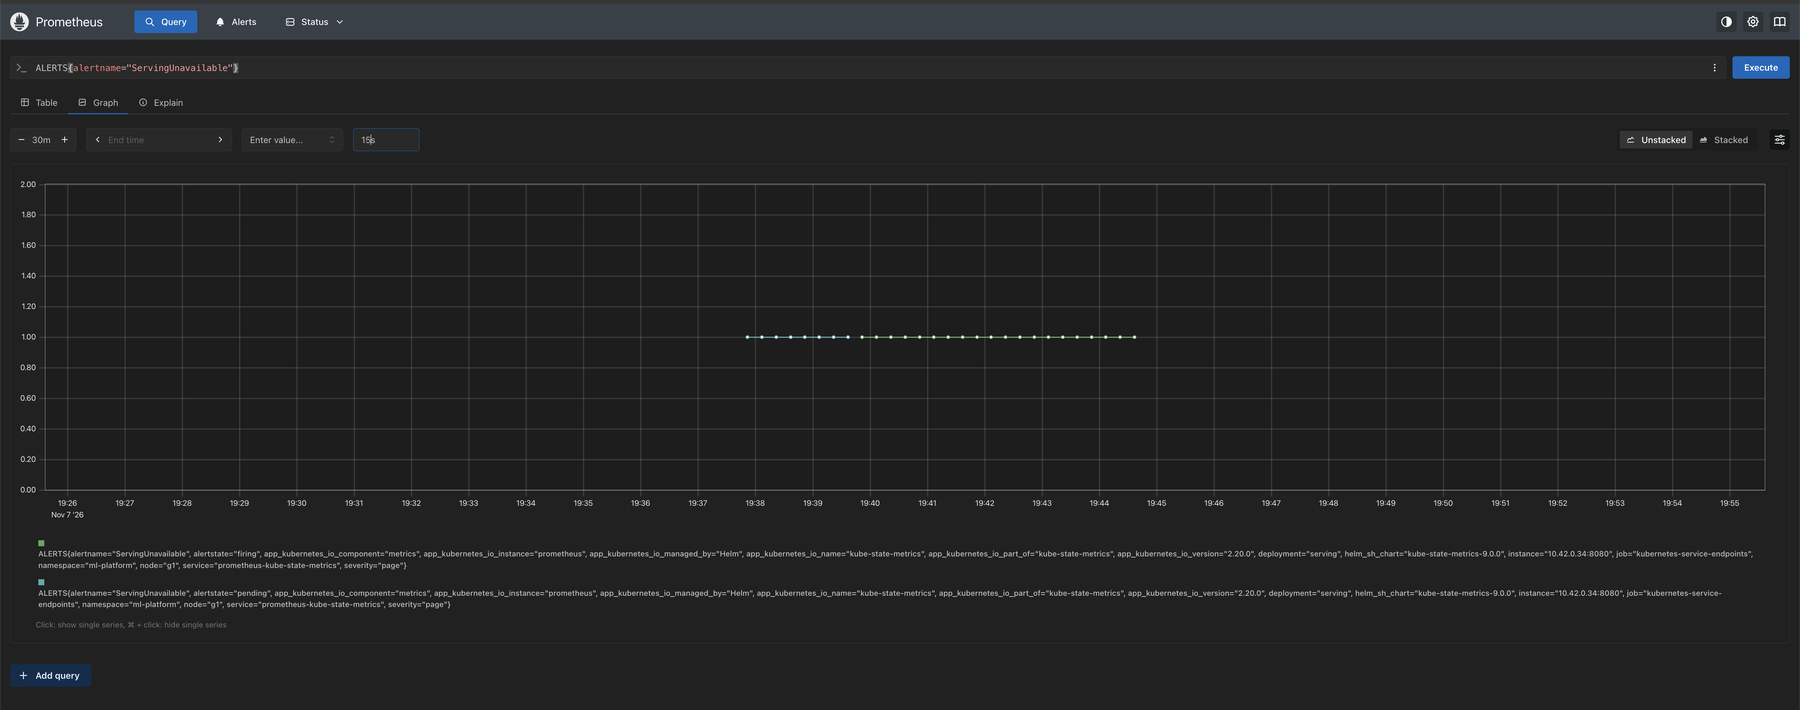 Figure 2: the alert’s two states over time (Prometheus, UTC). Pending first, then firing exactly two minutes later.
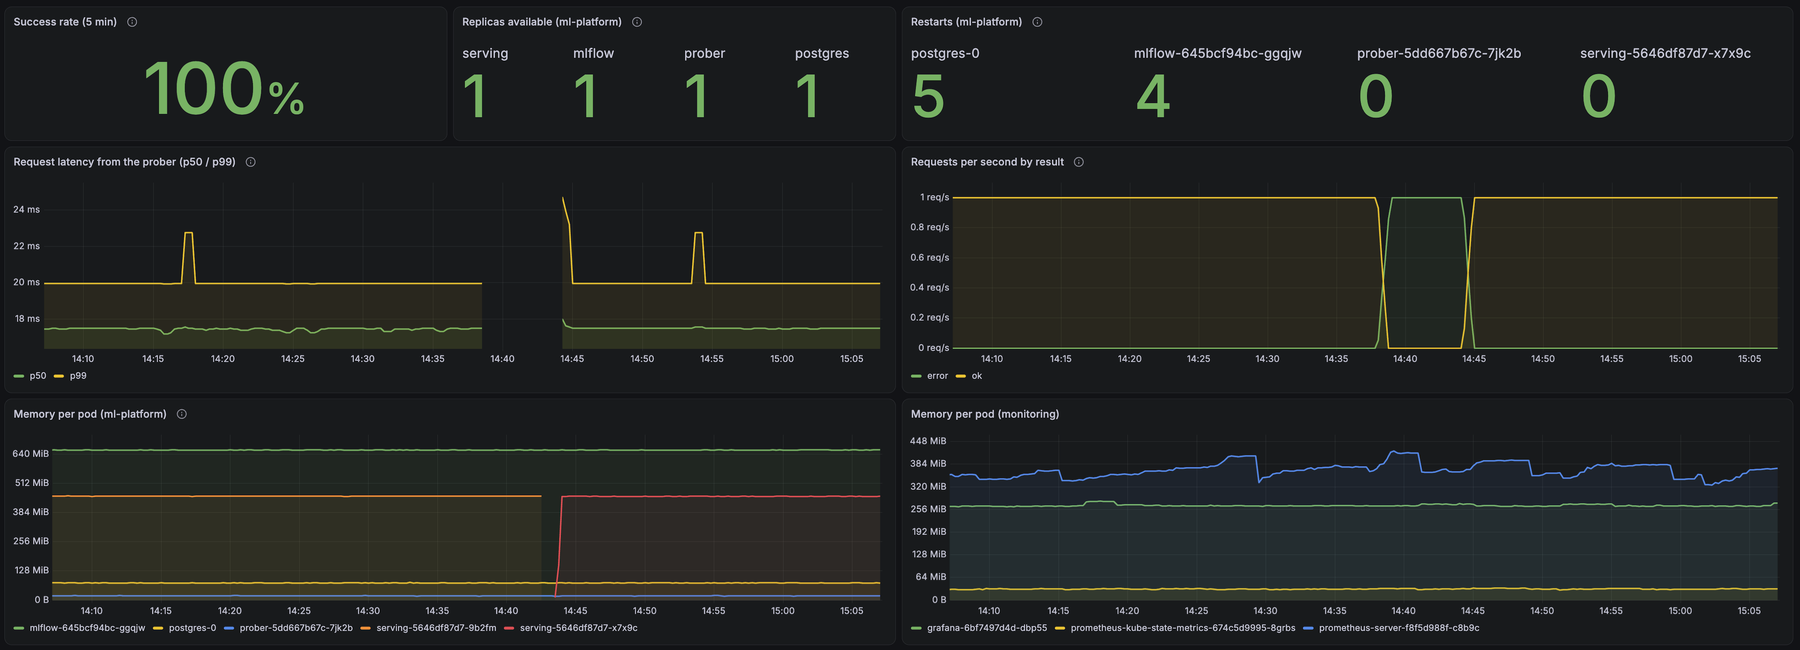 Figure 3: the dashboard an hour after the outage (Grafana shows local time, UTC−5, so the outage is 14:38 to 14:44 here). The success-rate tile reads 100% because the outage had left its 5-minute window by the time of this screenshot; during the outage it read 36.7%. Note the latency lines stop during the outage.
372 failed requests is about 6 minutes at one request per second. 372 / 6,480 = 5.7% of the monthly availability budget, spent by one outage. Roughly 17 outages like it in a month would use the whole budget.
For comparison, during a normal rolling restart of the same pod the prober saw 0 failed requests and a p99 bump from about 20 ms to about 22 ms. A separate request loop saw 0 failures out of more than 1,100 requests during an earlier rollout.
Why it happens
The alert took two minutes because I told it to. The rule has for: 2m, and the timer starts when the condition first becomes true (pending), not when the pod disappears. With a 15 s scrape and a 1 minute rule evaluation, firing lands between 2 and about 3 minutes after the failure starts. Shortening for reacts faster and gives more false alarms: a 30-second pod restart should not page anyone.
The latency graph went blank because of how the number is computed. p99 comes from the histogram of successful requests. With no successes in the window there is nothing to compute, so the line stops. An outage looks like “no data”, not “slow”. The panels that showed it were the error rate, the success rate (36.7% in its 5-minute window at that moment) and the replica count. A latency panel on its own can look healthy during a total outage.
The alert cleared about 20 seconds late because the metric needs a scrape to change and the rule needs an evaluation to notice.
The outage lasted as long as it did partly because of how the pod starts. It installs its Python dependencies when it starts, which takes about 50 s before it can answer. Baking them into an image once would shorten every restart.
What this does not show
- Real traffic. One fixed request per second from inside the cluster. Real callers send bursts, different inputs and from many places.
- More than one run. I did the outage test once. The two-minute gap follows from the rule; the exact pending time depends on where the evaluation cycle lands.
- A good objective. 99.5% and 50 ms are numbers I chose from measured latency (p99 at most 20 ms), not from what users need. The 12-hours-a-day assumption exists because I shut the machine down at night.
- Slow failures. My alert fires only when no pod is available for 2 minutes. If 10% of requests failed for an hour, it would never fire. A burn-rate alert on the error budget would catch that; I have not built it.
- High availability. One replica on one node. With two replicas, a pod or node problem would not have been a total outage. This one was self-inflicted by scaling to zero.
- Exact latency. Prometheus estimates percentiles from histogram buckets (15, 20 and 25 ms edges here), so “p99 at most 20 ms” is a bound, not a precise value.
Reproduce or verify it
kubectl -n ml-platform scale deploy/serving --replicas=0
# watch http://localhost:9090/alerts and the Grafana dashboard for a few minutes
kubectl -n ml-platform scale deploy/serving --replicas=1
Queries used (Prometheus):
sum(increase(prober_requests_total{result="error"}[1h]))
ALERTS{alertname="ServingUnavailable"}
histogram_quantile(0.99, sum by (le) (rate(prober_request_duration_seconds_bucket[1m])))
The prober, the alert rule, the dashboard JSON and the step-by-step log with every prediction and result are in the lab repo.